
Everyone compares coding agents by asking which model is better. Three independent studies published in the first half of September suggest that is the wrong question. The bigger lever is the harness, and accepting the default can double your bill for the same result, or worse.
All three landed within 10 days: HarnessTax from UC Berkeley and Arena (September 16), a 43-page arXiv paper (September 17), and an independent benchmark running nine harnesses against a local model on a laptop (September 10). They agree with each other.
What a Harness Actually Is
A coding agent has two parts. The model: Claude Fable 5, GPT-5.6 Sol, Kimi K3. And the harness: the software layer that decides which tools the model can reach, how context gets managed, and how the execution loop runs. Claude Code is a harness. So are Codex CLI, Cursor, Cline, opencode and goose.
When you pick a coding agent you are picking both, but we only ever talk about one. “I use Claude Code” bundles a model and a harness together, and until now nobody had measured their contributions separately. That is exactly what the Berkeley team did.
The Berkeley Measurement: 21 Model-Harness Pairs
The team led by Melissa Z. Pan (with Ion Stoica and Matei Zaharia among the authors) paired seven models with three harnesses: Claude Code, Codex CLI and Pi. Pi is a minimal open-source harness with exactly four tools: read, write, edit, bash.
They ran SWE-bench Lite and Terminal-Bench 2.0 on 30 randomly sampled tasks, three repetitions per point, 21 combinations total.
| Claude Fable 5 running in | Claude Code | Codex CLI | Pi |
|---|---|---|---|
| Success rate | 97.8% | 96.7% | 96.7% |
| Cost per attempt | $1.33 | - | $0.67 |
| Average turns | 15.3 | - | 15.4 |
| Tool count | Many | 10 | 4 |
The short version: twice the money for 1.1% more success. Even the turn count is nearly identical (15.3 vs 15.4), so the agent takes the same number of steps. Each step just costs more.
This is not one model being weird. Across shared models, using geometric means of cost ratios, Claude Code costs about 2.0x Pi and 1.6x Codex on SWE-bench Lite, and 1.5x Pi on Terminal-Bench 2.0. Meanwhile the average harness effect on success rate stays within ±2% on SWE-bench Lite and about ±5% on Terminal-Bench 2.0.
The team calls this the harness tax: what you pay for accepting a default without comparing alternatives, and what never shows up as a line item on your invoice.
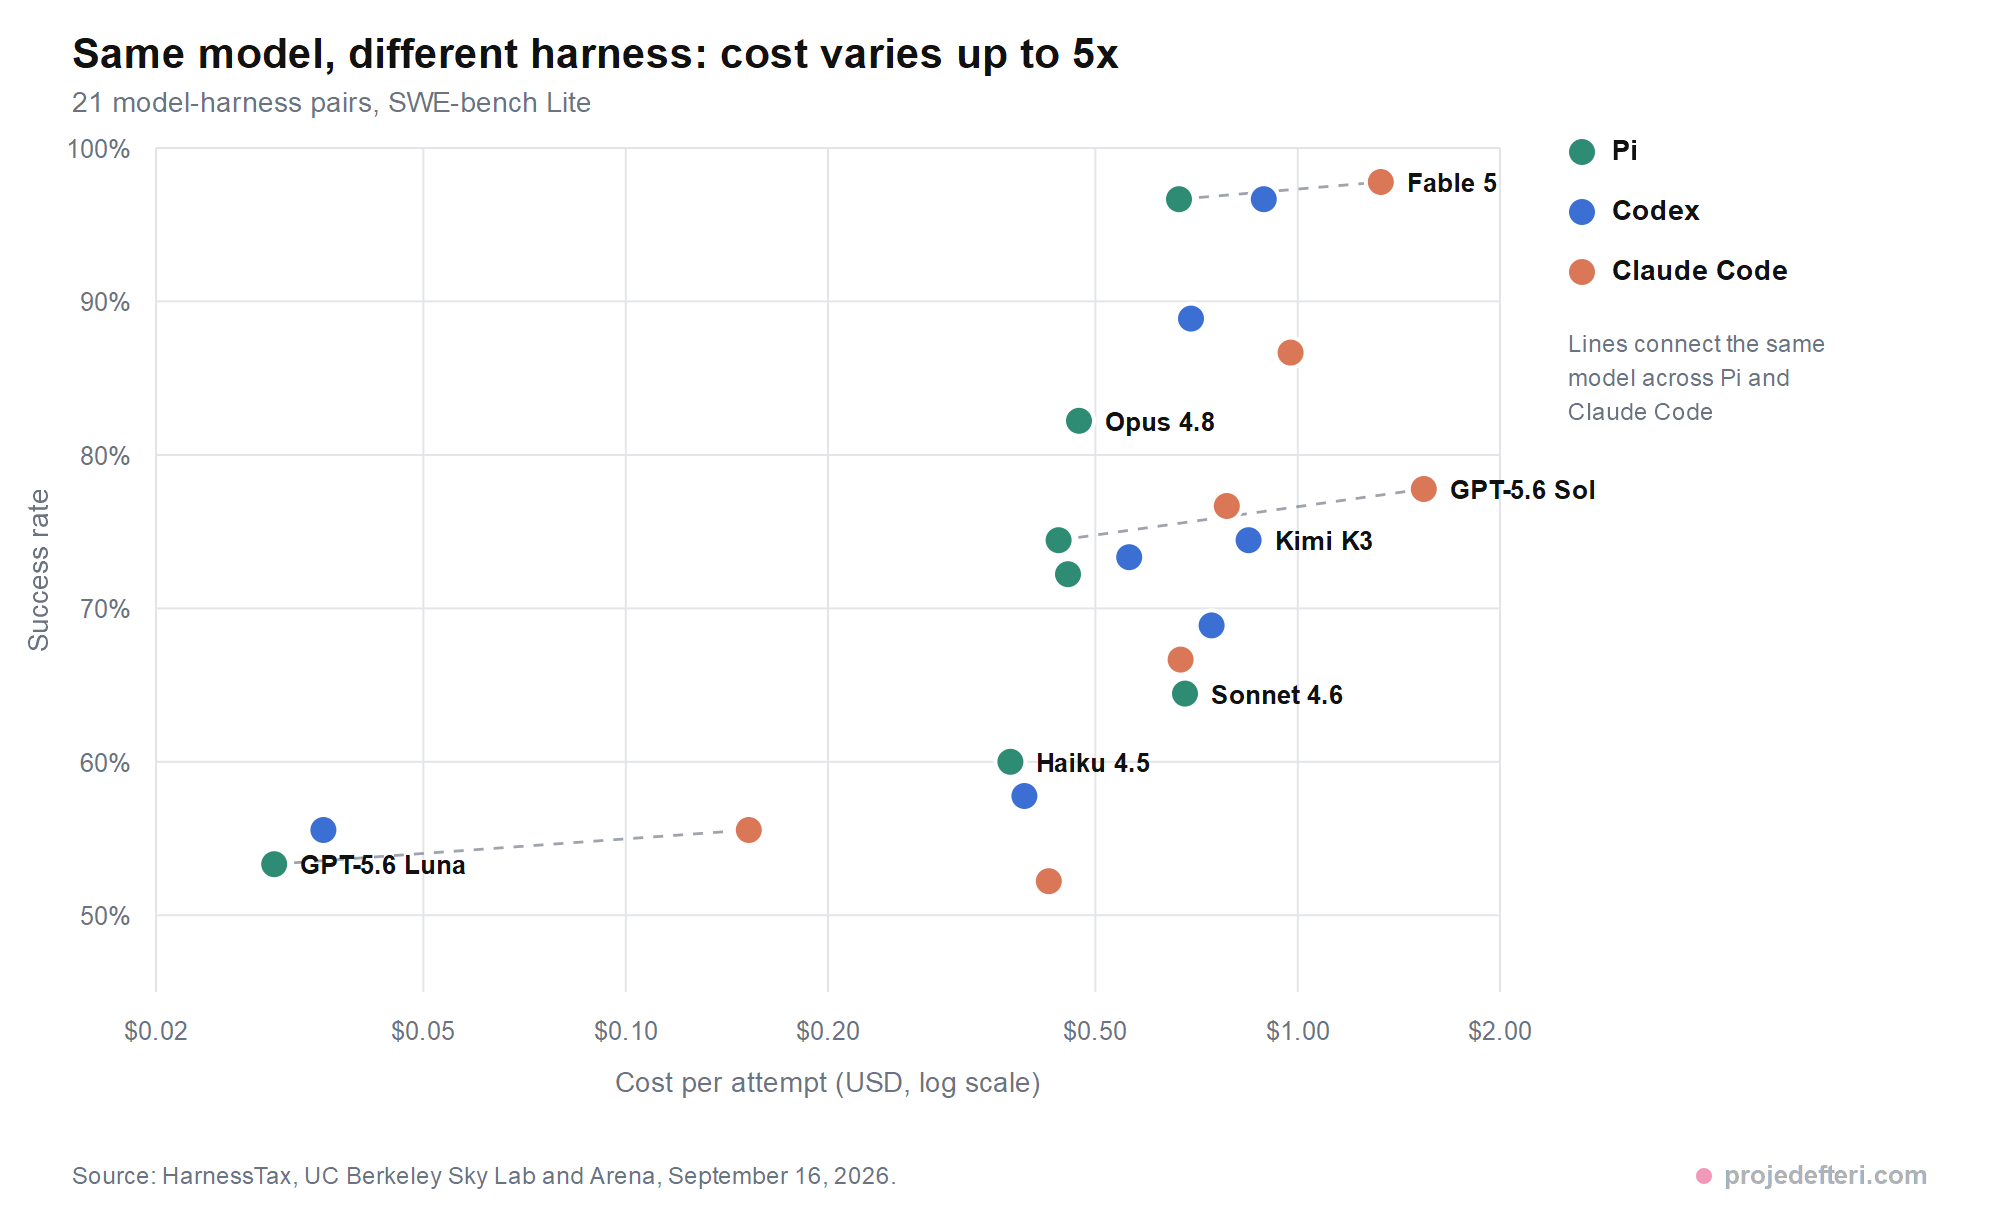
What matters in this chart is the horizontal spread. A model’s three points sit at nearly the same height, so success barely moves. They separate sideways instead. GPT-5.6 Luna is the extreme case: $0.03 per attempt in Pi, $0.15 in Claude Code. Five times the price.
The Tax Starts on the First Call
The Berkeley team also traced where the money goes. The most striking number is in the very first model call: Claude Code’s mean initial context is over 10x Pi’s, driven by longer instructions and larger tool schemas.
Provider-reported input on that first call averages 1,972 tokens in Pi, 11,308 in Codex and 27,011 in Claude Code. The instruction text itself spreads even wider: 2,873 characters for Pi, 18,114 for Codex, 76,995 for Claude Code. Tool counts follow the same shape, at 4, an average of 7.4, and 23.
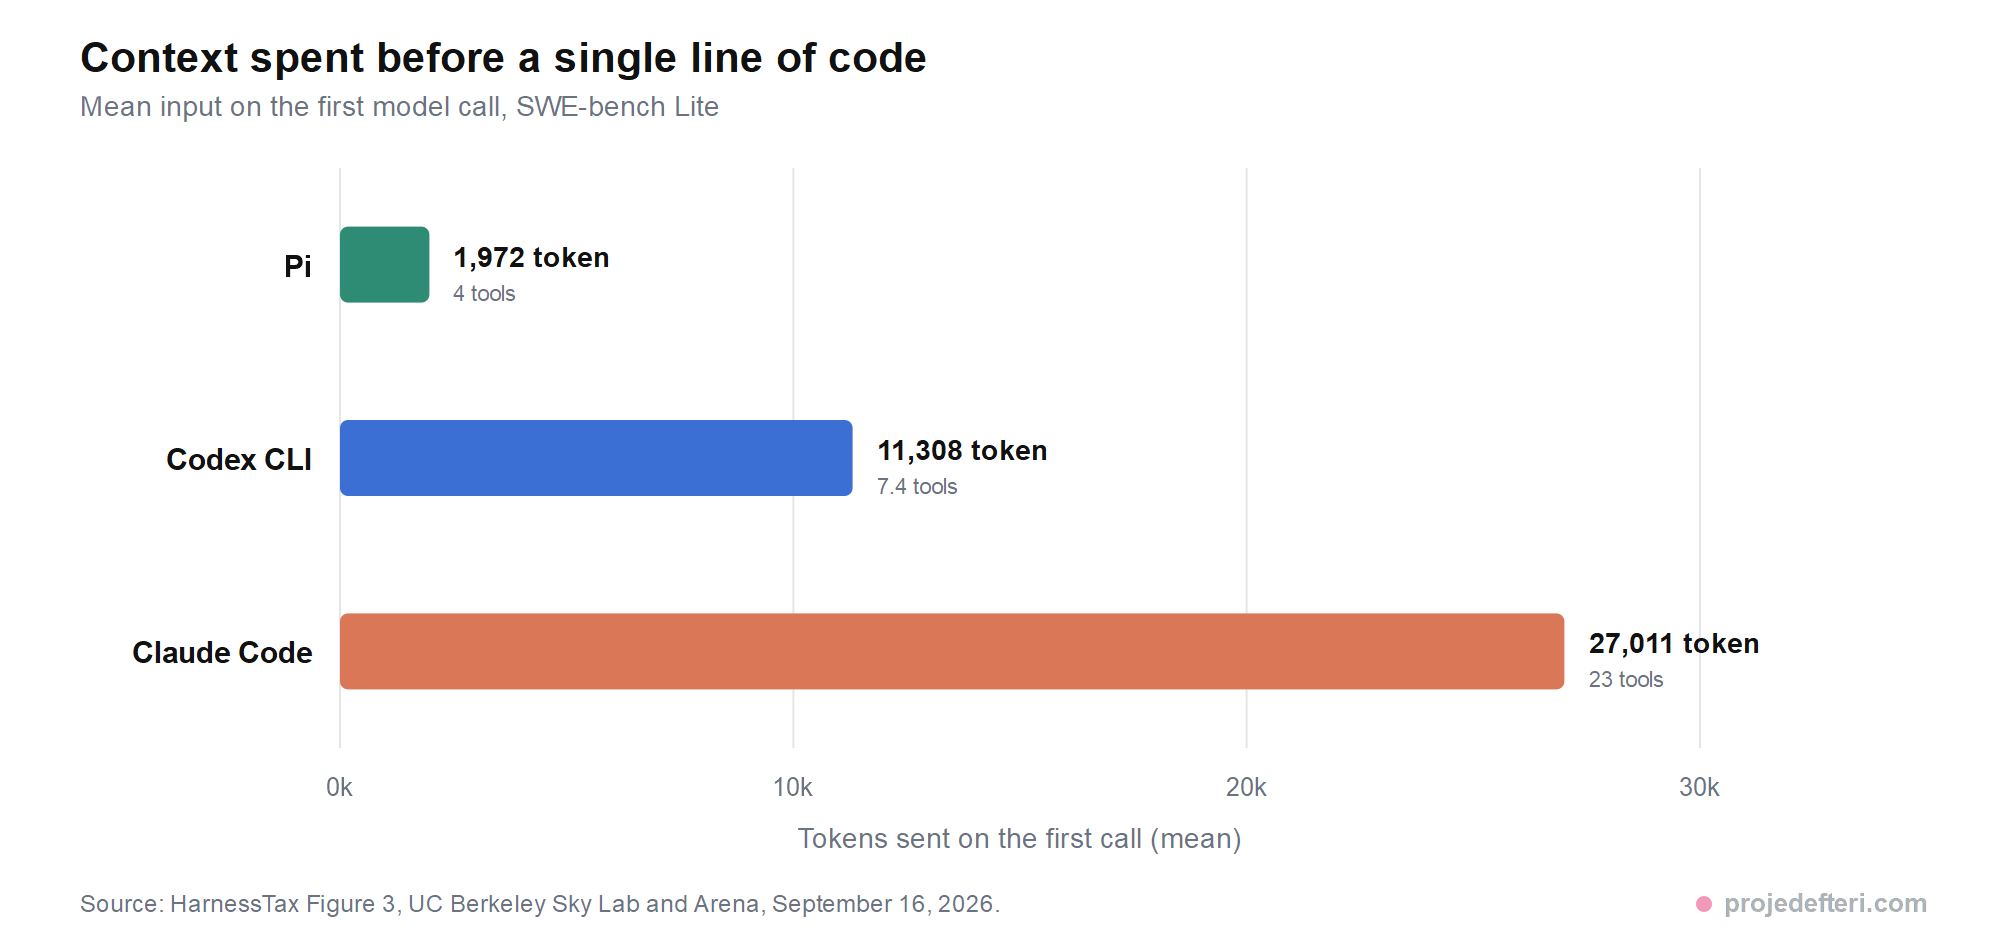
That is a bill you pay before any work happens. Before the agent reads a file, runs a command or writes a line of code, the model has already consumed thousands of tokens of preamble. Caching softens this, but it does not erase it.
To see what that means at your own volume, drop your monthly numbers into the LLM cost calculator . Doubling a $40 month is $20; doubling it across a ten-person team is a different conversation.
On a Flat-Rate Plan, the Tax Shows Up Elsewhere
One distinction worth making: the Berkeley study measured API token cost. If you use Claude Code or Codex CLI on a flat monthly subscription, nothing on your invoice changes, because the invoice is fixed.
The cost surfaces somewhere else: you hit usage limits twice as fast. A harness that spends twice the tokens for the same task lets you do half the work inside the same plan. When you wonder why you keep running out of quota mid-afternoon, the answer is often not the model but the baggage the harness carries on every call.
If you run on an API key instead, the difference converts straight into money and scales linearly with your monthly volume.
Your Model May Do Better Outside Its Own Harness
This is the least expected finding. Providers say they optimize models for their own environments. OpenAI describes GPT-5-Codex as optimized for agentic software engineering inside Codex.
The measurements do not back that up. Across six Anthropic and OpenAI models and both benchmarks, an alternative harness achieved the highest observed success rate in 9 of 12 comparisons.
| Comparison | Own harness | Alternative | Cost change |
|---|---|---|---|
| Sonnet 4.6, SWE-bench Lite | Claude Code 66.7% | Codex 68.9% | Similar |
| GPT-5.6 Sol, Terminal-Bench 2.0 | Codex 78.9% | Pi 83.3% | $0.76 → $0.42 |
| Fable 5, SWE-bench Lite | Claude Code 97.8% | Pi 96.7% | $1.33 → $0.67 |
The GPT-5.6 Sol row is the one to stare at: outside its own harness it is both more successful and half the price.
Open weights hold up too. Kimi K3 sits close to GPT-5.6 Sol on SWE-bench Lite and near the Pareto frontier, which undercuts the assumption that closed models are required for frontier agent results.
The Second Study: Which Component Does the Work?
Berkeley compared harnesses as whole systems. The arXiv:2609.20804 paper from September 17 did the opposite: it froze the execution loop and varied three components one at a time.
Run-Ze Fan and colleagues evaluated 176 matched settings across four models on SWE-Bench Verified and Terminal-Bench 2.1: five context-management strategies, four context-window budgets, plus targeted planning and action-space ablations. The 43-page result says:
- Context management gets more valuable as the context-window budget tightens, and most of the benefit comes from preventing context-overflow failures rather than improving reasoning.
- The most efficient strategy stages rule-based elision before LLM summarization. Making elided content recoverable adds machinery models rarely use and yields no accuracy gain.
- Planning shifts role with model strength: an accuracy scaffold for weaker models, a cost saver for stronger ones, with little accuracy change either way.
- Action space: predefined tools help models with weak bash proficiency. Bash-capable models run fine on a bash-only interface at substantially lower cost, especially on command-line-centric tasks.
That last point lines up exactly with Berkeley: Pi’s four tools do the job of a 26-tool harness on a strong model, and burn fewer tokens doing it.
On a Laptop, the Tax Compounds
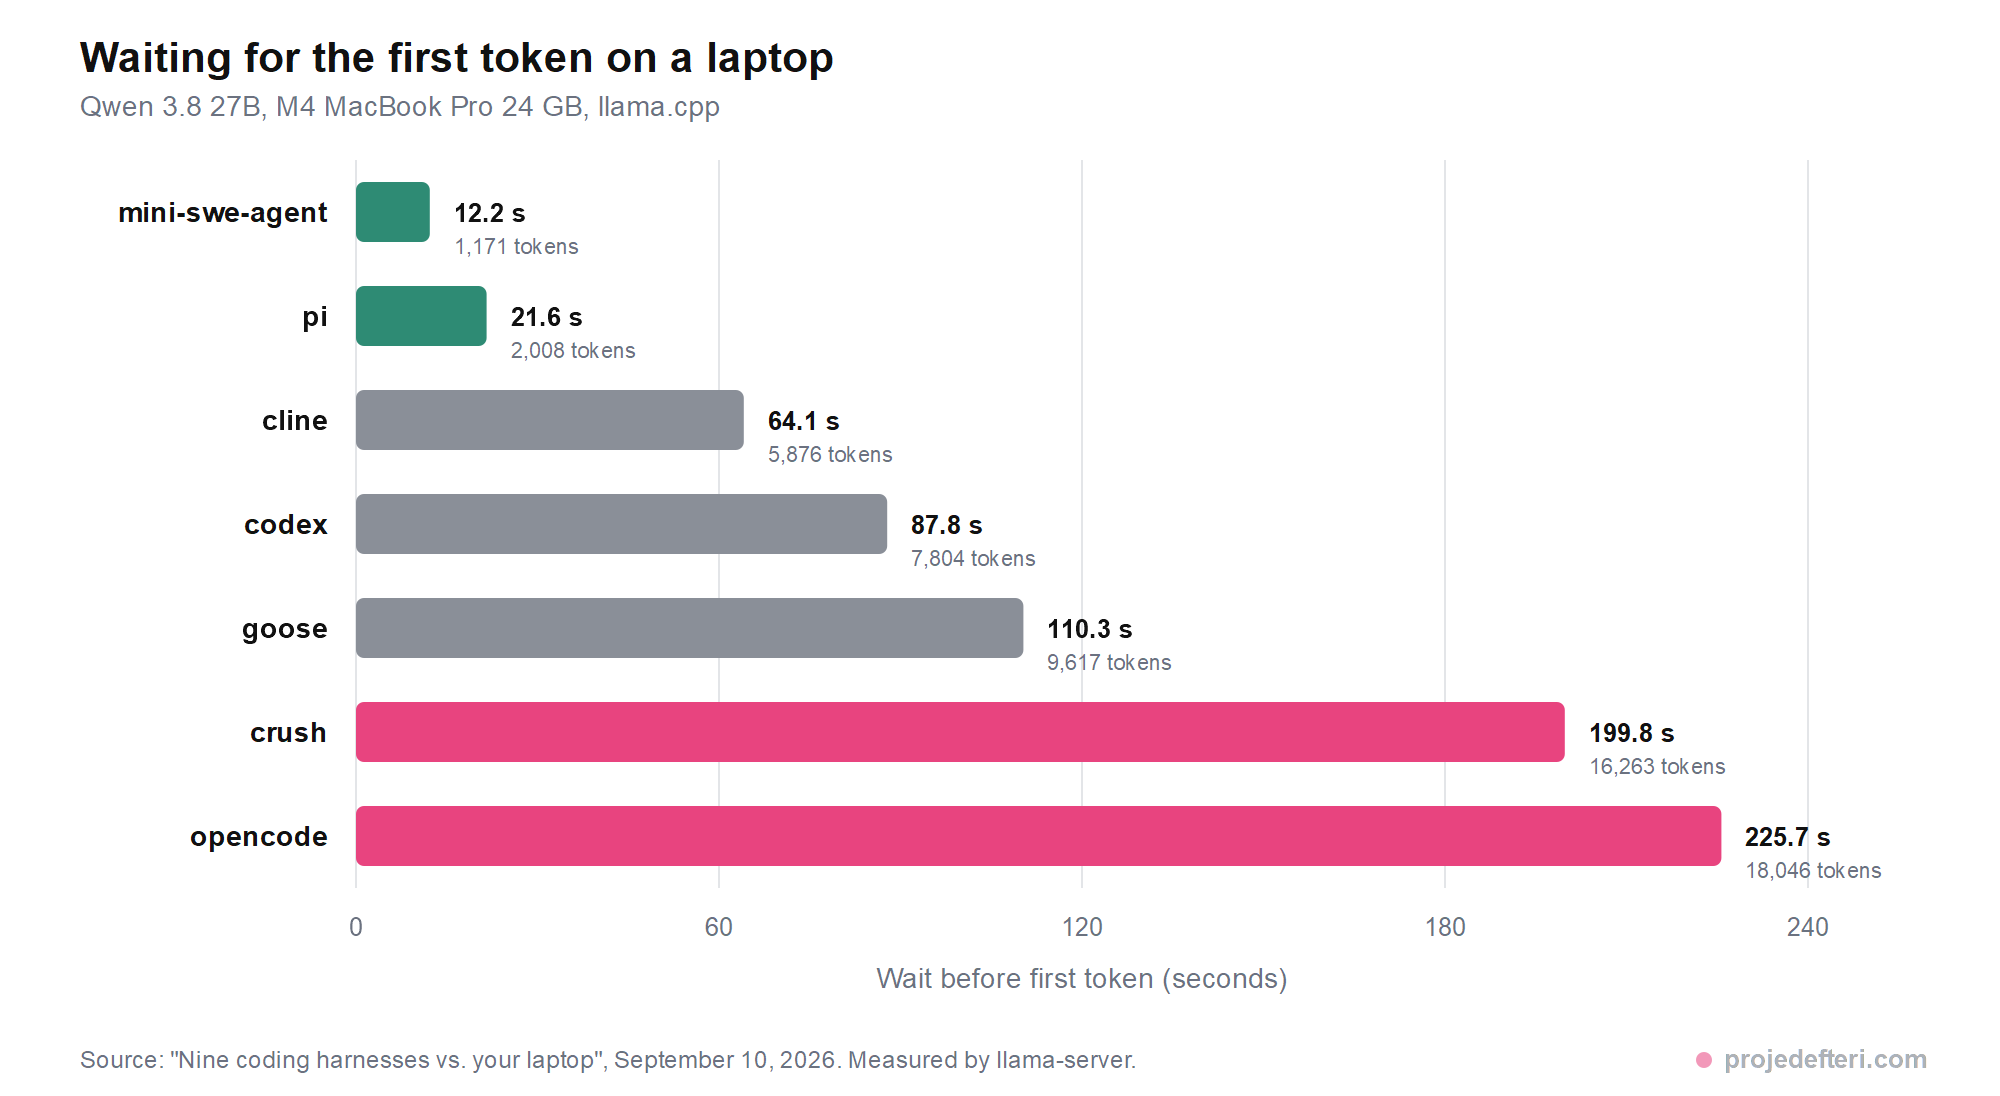
The third measurement moves the problem somewhere else entirely. Nine harnesses ran on one MacBook Pro (M4, 24 GB) against a 3-bit Qwen 3.8 27B served through llama.cpp, across eight Exercism tasks.
The arithmetic here is brutal. A laptop reads roughly 90 tokens per second and writes about 10. Every 1,000 tokens of system prompt costs around 11 seconds of staring at a cursor. What is invisible at data-center prefill rates of 10k+ tokens per second becomes the entire experience on localhost.
| Harness | Turn-1 prompt | Wait before 1st token | Tools | Tasks passed |
|---|---|---|---|---|
| mini-swe-agent | 1,171 tokens | 12.2 s | 1 | 11/24 |
| pi | 2,008 tokens | 21.6 s | 4 | 19/24 |
| cline | 5,876 tokens | 64.1 s | 26 | 17/24 |
| codex | 7,804 tokens | 87.8 s | 10 | 19/24 |
| goose | 9,617 tokens | 110.3 s | 18 | 22/24 |
| crush | 16,263 tokens | 199.8 s | 26 | 18/24 |
| opencode | 18,046 tokens | 225.7 s | 10 | 15/24 |
That gap is 204 seconds between opencode and pi just to see the first token, repeated at the start of every session.
Context tells the same story. On a decent laptop with a decent model you have roughly 32,000 tokens left to work with. Pi leaves you 94% of that budget. Opencode spends 18,046 tokens walking in the door, so you keep 44%.
There is a third tax: side requests. Harnesses fire background calls for session titles and summaries. Across 24 tasks opencode fired 33, crush 51 and dsh 24, nearly all of them overlapping an agent turn. The model appeared busy for 125% of wall clock under opencode and 114% under crush, meaning two requests in flight on one GPU.
chad, one of the harnesses in the table, and says so up front. Read its 24/24 pass rate as an illustration of the method rather than a ranking. Every other harness number comes from llama-server’s own accounting.Where Are Cursor and Cline in This?
The Berkeley study covers three harnesses: Claude Code, Codex CLI and Pi. Cursor, Windsurf and Cline are not in it. Cline shows up only in the laptop benchmark, with 26 tools, a 5,876-token turn-one prompt and a 64.1-second wait before the first token.
That does not leave you blind about the rest. The mechanism being measured is tool-agnostic and identical everywhere: initial context size, number of tool schemas, side-request traffic and cache hit rate. Pull those four numbers for whatever you use and you can place it on the same scale.
Editor-embedded tools like Cursor and Windsurf add one more layer: file indexing, an autocomplete model and editor context all consume tokens too. Since they ship with their own subscription pricing, their harness tax also lands on your usage limits rather than on an invoice line.
Why Big System Prompts Exist
Reading those tables as “opencode is badly built” would be wrong, and the author of that benchmark says so explicitly. An 18,000-token system prompt is there because it genuinely helps frontier models deployed behind an API. Twenty-six tool schemas are fine when you have 200,000 tokens of context and prefill is effectively instant.
Every one of those design decisions was made in an environment where prefill is free. Reading 18,046 tokens takes 1.8 seconds in a data center. The same work takes 226 seconds on a laptop. Same code, same prompt, 125x difference.
So the problem is not that these harnesses are poorly engineered. It is that their assumptions no longer hold everywhere. A tool optimized for the data center becomes unusable against a local model, and on the API the same weight shows up quietly on the invoice instead.
How to Measure Your Own Harness Tax
You do not need a research lab to reproduce this on your own project. Three steps:
- Measure the first call. Most harnesses expose a debug or verbose mode that prints the system prompt and tool schemas; that gives you the token count directly. Pasting the raw text into the token counter works too. You will land somewhere between 2,000 and 18,000.
- Run one real task in two harnesses. Pick an actual ticket, give the identical prompt word for word, and compare total token usage. One run is not enough: do at least three repetitions, the same number Berkeley used per data point.
- Compare money, not turns. In the Fable 5 case the turn counts were 15.3 versus 15.4, essentially identical. The entire gap was tokens spent per turn, so “it finished in fewer steps” tells you nothing about cost.
That whole exercise fits in an afternoon, and the result reflects your workload rather than a public benchmark. Which is the part that actually matters: the measurement happens on your codebase.
What to Actually Do
Five things that follow from the three studies:
- Question the default. Keep your subscription and your model, swap the harness, and you may halve your cost. In the Berkeley measurement the success difference stayed at noise level.
- Choose model and harness separately. “I use a Claude model so I should use Claude Code” was wrong in 9 of 12 comparisons.
- If you run local models, the harness choice dominates. If you followed the setup in running Claude Code with Ollama, Kimi and GLM , moving to a harness with a small system prompt may be your single biggest speed win.
- Count the tools. A 26-tool harness does not beat a 4-tool harness on a strong model, but you pay for those schemas on every call.
- Measure your own bill. Use the token counter for volume and the cost calculator for money. A 2x difference is not an abstraction.
Caveats
The Berkeley team states its own limits: the measurement covers two open-source benchmarks the models may have seen during training. Other workloads may behave differently.
Benchmark tasks also do not represent a full development session. Cross-session memory, feedback loops and long-running work sit outside these tests, and richer harness features may be exactly what pays off there.
And none of the three studies claims that simpler always wins. The argument is finer than that: harness complexity is an empirical trade-off that depends on model strength, workload and context budget. Stronger models need less scaffolding; hard problems at the edge of a model’s ability still benefit from structured guidance.
For everyday work the message is blunt, though. How you use Claude Code matters, and so does which harness you run it in. Nobody was telling you that part.